I used to have a Google AdSense "ad" here but the AdSense people at Google kept sending out homosexual oriented garbage so I deleted it. The jerks."
GDP Cut in HALF!!!
GDP was about halved in the second quarter of 2006 by figures out this morning from the Bureau of Economic Analysis: http://www.bea.gov/bea/newsrelarchive/2006/gdp206f.pdf
India
The country’s economy has expanded at an average rate of 8% over the last three years. Just in the quarter ended June 30, it charged ahead by 8.4%.
Naturally, personal incomes are also quickly rising in India. Salaries are expected to increase 7.3% this year, the biggest jump of any of the 70 countries that the International Monetary Fund monitors.
Europe, Japan Wean Themselves From Dependence on U.S. Consumers
Sept. 25 (Bloomberg) -- Europe, Japan and emerging economies around the world are weaning themselves from dependence on the American consumer, and economists say it's just in time.
Demand in the world's largest economy is slowing as the U.S. housing market falters, a development that the International Monetary Fund on Sept. 14 called a key risk to global expansion. If so, it's a risk that the biggest exporting nations are better prepared to weather now than five years ago.
Click HERE for the FULL Story
Trouble Predicted, BIG Trouble
Fred Hickey is used to going against the crowd.
Everyone scoffed in 1999 when the veteran Nashua, N.H., stock market guru, who publishes the influential High-Tech Strategist investment newsletter, warned that the tech bubble was going to pop. And they dismissed him as a wild alarmist early last year when he said house prices were going to slump.
What’s his view now? "I think we’re going to have a crash, across the stock market,” he told me Friday.
Click HERE for the FULL Story
OMG
From: The Mogambo Guru, 20 SEPT 2006
-- If you like theater of the absurd, then you will love "Everyone Loves A Parade!" by Rob Kirby of Kirby Analytics. He writes "J.P. Morgan Chase's derivatives book grew from 48.26 Trillion notional at Q4/05 to 53.76 Trillion at Q1/06. That's RECORD new growth of 5.5 TRILLION notional, folks!"
Note the clever use of capitalization to indicate emphasis, which makes the ending exclamation point seem almost, umm, understated. Seizing my red "Editor's pencil", I change it to read... "$5.5 TRILLION notional, folks!!" with the more powerful double exclamation point, which seems better suited to convey the significance of it all.
But, if you are like me, then your eyes immediately glazed over at the shock of learning that this is somehow vitally important but we have no idea what or why, made more mysterious and scary by the sheer incomprehensibility of the creation of $5.5 trillion in new derivatives in one quarter.
Mr. Kirby, wise to the ways of The Mogambo, sees that first little bit of Stunned-Mogambo Drool (SMD) coming out of the corner of my mouth, and instantly realizing his mistake, quickly backtracks by saying "Let's first try to quantify just how much a $5.5 trillion build in a derivatives trading book over a three month period really is, shall we?"
My mind is charmed by his use of the word "we", as we both know he means "him", as I am far, far, far too stupid to participate in building anything (unless you define "making of mess of everything I touch" as "building", except maybe in a Schumpeterian "creative destruction" kind of way), and sure enough he goes on without me, saying "The first quarter of 2006 contained 65 business days [64 excluding Presidents Day]. $5.5 Trillion divided by 65 equals $84.6 Billion per day in NEW BUSINESS - forgetting rollover of existing business which, in itself, must be massive."
Someone is creating $84 billion, per day, in new derivatives contracts? I leap to my feet and shout "One day? In one day? In one freaking day?" I am stunned. I am scared.
Using the GDP to measure inflation
From "The Mogambo" Sept 20, 2006
"Raw GDP is the way the US measures GDP, which is the total of money made from final sales. Some of that is, of course, the result of higher prices."
"The reason that this is so important to figure in is that, by example, if last year the raw GDP number came from selling one widget for a buck (a $1 GDP), and this year raw GDP was one widget sold for two bucks (a $2 GDP), the economy looks like it doubled! GDP went from $1 to $2!" Everyone then says how wonderful the economy is doing.
But in reality, it did not actually grow; only one widget was made and sold still! The only thing that changed was the price of the widget. That is a result of inflation itself.
So if you want to know how the REAL economy is going in the exciting world of GDP and widget-making, you have to reduce the raw GDP figure by the rate of inflation.
Uh-oh!! Those of you familiar with the Mogambo Theory Of Soundtracks (MTOS) recognize the sense of foreboding doom as, suddenly, the soundtrack is filled with low, rumbling horns making screechy, horrible, dis-chords, and the penetrating sound of doomed souls wailing in economic and financial despair. Obviously, this is where it gets very interesting!
See, if the rate of inflation that you use to deflate the raw GDP number is too low (like it is now!), then the estimate of real, inflation-adjusted GDP is too high! The economy looks like it is going great, but it is, obviously, not. It's just that prices are rising!
So, if GDP is predicted to grow only 2.9%, with the assumption that inflation is only 3%, then the error is huuuUUUuuge when you use the 3% inflation to go back to get the raw GDP number, and then deflate by the actual rate of inflation (probably somewhere between 4.1% and 10%).
When you do that, you get a result that is so horrible, so terrifying to see that, like looking at a Gorgon, my brain is literally turning to stone, and all I can do is claw at my own head and cry out in anguish, "Not only are we in recession, as real GDP growth is actually negative, but we have been in one for years and years! Gaaahhh!"
To repeat: We are, and have been, in a recession, according to the new inflation number!
How to measure inflation
The idea is to convert back to the old way of calculating inflation, as measured by the Consumer Price Index (CPI), which is a theoretical market basket of goods, supposedly representing what people routinely buy, and used to calculate inflation by noting the changes in the prices of each item from month to month. Seems simple enough.
For the last quarter of a century, however, the CPI has "conveniently" left out the costs of energy and food. But now, thanks to public outrage, things may soon change, and the much-abused-and-viciously-contorted CPI may be replaced by the "trimmed mean PCE", as explained by Dallas Fed's top dog Harvey Rosenblum, who said "The Federal Reserve should move away from using inflation measures that exclude food and energy since they make the central bank seem aloof from the reality of rising costs faced by Americans. Excluding food and energy angers many people. It makes the Fed seem out of touch."
And why are food and energy excluded from modern calculations of inflation in the first place? To lie, my naïve little darling! Why else does the government change anything? Hahahaha! They don't see it that way, of course, and instead rationalize it as "Food and energy costs were originally excluded from the inflationary equation in the late 1970s," he says, "when prices in those sectors were particularly volatile." He admits that "the measure is now outdated and does not capture the full scope of underlying price shifts."
-- The Mogambo. Sept 20, 2006
Dollar vs Gold
As Bill Bonner of DailyReckoning.com writes, "Let me put it to you straight. How many times have paper currencies - unbacked by gold - become worthless? Answer: every time. And how many times has a gold currency lost its value? Never."
The Coming Consumer Crunch
by Nilus Mattive
Weiss Research, Inc.
When I moved to New York City to start my career on Wall Street, I quickly learned that the most popular sport in town wasn’t baseball, basketball, or football … it was full-contact shopping. My friends and co-workers whiled away their non-working hours hitting every boutique from Soho to Midtown, eating at fancy restaurants, and frequenting expensive bars. And their habits were dangerously contagious. Since I’ve moved down here to Florida, I realize that the New York lifestyle is a bit hyperbolic – most folks don’t happily fork over $10 for a beer.
Still, I think the behavior pattern holds true all across our fair land: A walk in the park is no longer as fun as a walk through the mall. Spending is now beyond the national pastime. It’s a nationwide pandemic. What makes this so worrisome is the fact that our economy relies on "Spend-Happy" consumers. Some people say consumer spending accounts for two-thirds of U.S. gross domestic product. But it’s actually getting closer to three-fourths of the economy.
Wall Street loves touting this statistic when Americans are borrowing, spending, and generally feeling good about the future. And indeed, just yesterday, the July consumer spending numbers came in – the strongest in nine months. Everyone cheered the news, proclaiming that the back-to-school season got off to a stellar start. But the real question is: How long can this last? Already, even though people keep on shopping, their faith in the future is dropping:
• The University of Michigan’s overall consumer sentiment index has plunged to 78.7 in the preliminary August reading vs. 84.7 in the final July result.
That’s the lowest since last October, when Americans were still reeling from Hurricanes Katrina and Rita.
• The index reflecting current economic conditions also fell – to 100.8 from 103.5 in July. In other words, the survey respondents aren’t happy about things right now.
• Consumers don’t have much hope for the future, either – the economic outlook index dropped to 64.5 from 72.5.
Another major consumer survey, from the Conference Board, just came out three days ago. It painted a similar picture – Americans’ faith in the economy plunged to a
nine-month low.
It’s easy to see what’s got everybody down: Conflicts and terrorism, rising gas prices, higher interest rates, signs that inflation is ramping up, as well as job-related worries. Plus, the latest home sales data has been downright awful.
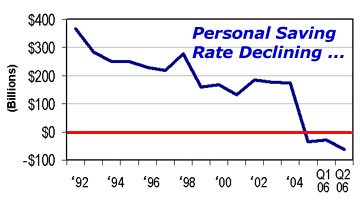
Despite all this, people are still spending (for now). That begs the question: Where are they getting the money? The last time American consumers spent more than they earned was during the Great Depression. Now, they ’re doing it again!! The U.S. Commerce Department's Bureau of Economic Analysis (BEA) reports that our country had a negative savings rate of -0.5% in 2005. And so far this year, this unfortunate trend seems to be holding.

In a growing economy, when times are supposedly good, this is absolutely unprecedented.
By contrast, Americans were fairly strong savers in almost every single year from the end of World War II through the middle of the 1980s. In 1985, the average U.S. citizen saved a respectable 11.1% of disposable income. No more! So why are people continuing to spend? Probably because of the gains they have in their homes, stocks, and bonds. Of course, those gains are unpredictable. Anyone counting on them is failing to see the impact that losses can have. Meanwhile, people feel wealthier simply because their assets have risen in value. This powerful force is known as the wealth effect. The general sentiment is, “Never mind that it might not last, I’m worth a million bucks right now.” With the wealth effect, comes a propensity to save less in other places. This is why, even if you look at other measures of savings, you’ll see a negative trend. For example, a study conducted by the Spectrem Group, a research firm, found that participation in company 401(k) retirement plans fell from 80% in 1999 to 70% in 2005. In addition, the average contribution rate fell from 8.9% in 1999 to 6.9% last year. And there’s another, even more dangerous aspect to the wealth effect: It compels people to borrow more. And therein lies my biggest worry … According to the Federal Reserve, consumer borrowing rose at an annual rate of 5.7% in June, after a 3.3% increase in May. In dollar terms, consumers borrowed $10.27 billion more than they did last year. That’s a heck of a lot more than the $3.7 billion economists were expecting.
More troublesome – the faster-than-expected jump was mainly the result of more credit card debt. In June alone, borrowing on credit cards and other “revolving” debt rose at an annual rate of 9.8% … on the heels of an 11% gain in May. That’s over twice as fast as the entire economy’s growth! All this borrowing pushed total consumer credit to a record annual rate of $2.19 trillion. And this doesn’t even include mortgages or other real estate loans. Americans who refinance their mortgages will cash out $257 billion from their homes this year, according to mortgage lender Freddie Mac. That’s a whopping FIFTEEN times more than the refinancing cash-outs of just ten years ago! Even Freddie Mac’s chief economist, Frank Nothaft, was surprised: ”I would have thought the home equity extractions would have been much weaker now. " I would have thought so too, Frank. But you can never underestimate the allure of gourmet meals and designer handbags.